

Q9 Changes Over Time
The video above is posted on YouTube. It describes the importance of being counted, and urges everyone to be counted in the 2020 census, that already happened. The direct link below will take you to the U.S. Census Bureau site to play the video from their page.
Direct link to video on U.S. Census Bureau, Statistics in Schools, "Getting an Accurate Count"
Introduction
Students have access to lots of data that changes over time. Understanding what this data tells us is important as it can help us make decisions about things like where we live, career choices, and the world around us. In this Quest you will be learning about how data is collected about the state you live in as well as other states in the US; the increasing or decreasing populations in certain states; where most people live in the US; and how to interpret graphic representations of data that may inform things such as career choices.
I Can Statements
- analyze data and interpret changes over time
- use spreadsheets, charts and visual representations as tools to help organize and evaluate data
- create, organize, analyze and share representations of data in a spreadsheet, chart, graph, and data plot formats with my teacher and classmates
Key Vocabulary
Census: Census is the official count or survey of a population.
Findings: A Findings are conclusions reached after examination or investigation.
Inference: Inference is an idea or conclusion about something from known facts (evidence) and reasoning. An inference is also called an "educated guess."
Line graph: A line graph is a graph that uses one or more lines to show changes in statistics over time or space.
Statistics: Statistics is the collection and classification of data that are in the form of numbers. An example: Statistics are commonly used with sports, such as "runs batted in" (RBI) that help us predict things such as how likely a batter is to get a hit.
Vocabulary Game
Play the interactive Quizlet Game: Direct Link
There are two options to complete this Quest.
- The Standard Quest Steps located below
- The Q9 Breakout: Changes Over Time that is located on a subpage on the menu to the right. There is a separate Student Checklist and Teacher Guide for the Breakout Challenge Activity on the subpage.
Please check with your teacher about which option to use.
Steps
1. What is a census? Learn about the Census Bureau and how it is a leading go-to source of statistical information, and how it was created to address the U.S. Constitution.
- Optional: To learn more you can visit the Census Bureau 101 for Students website.
2. If you live in the U.S. visit the U.S. census statistics:
- Our example will look at Michigan Facts, but if you live in a different state, select your own from the list
- Locate a different state in the U.S. to get the facts
- If you live in a different country, we encourage you to pick a U.S. state for this activity, and also locate the statistics for your country or area and search for data across different years that can show change.
- Canada census fact sheets
- Use the World Factbook listing facts about most of the countries around the world
3. Making inferences based on data is an important skill that is used in many different jobs.
- Copy or download this 13.Q9 Changes Over Time Student Activity to explore the Census Data in more depth.
- You will use this Student Activity document to answer challenge questions such as: the population change in Michigan, how people get to work, household computer use, and Video/Disc rental stores.
- The image below is a screenshot of the Michigan population from the Census document as an example of answering questions using data.
Question: What changes do you observe about the median age of the population? How has it changed over the two time periods?
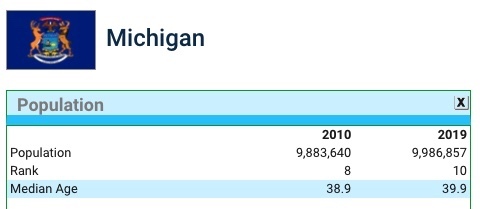
- Example observations: The Median age of the Michigan population increased from 38.9 years to 39.9 years from 2010 to 2019.
The population of the state increased by approximately 100,000 people between 2010 and 2019.
Check with your teacher to see if you can work with a partner or small group on the next activities.
Step 4. Creating Graphs of data to show Birth Rate Changes Over Time
You will apply some spreadsheet skills to create line, bar, or other graphs to observe the change in the number of births in three different U.S. states over the same four year period.
- Copy or download this 13.Q9 Birth Rate Changes Student Activity. This document can be copied or downloaded.
It includes a link to sample spreadsheets- Google sheet: 13.Q9 Changes in Birth Rate Google Sheets
- Microsoft Excel 13.Q9 Changes in Birth Rate.xls to download
Step-by-step Demonstration video
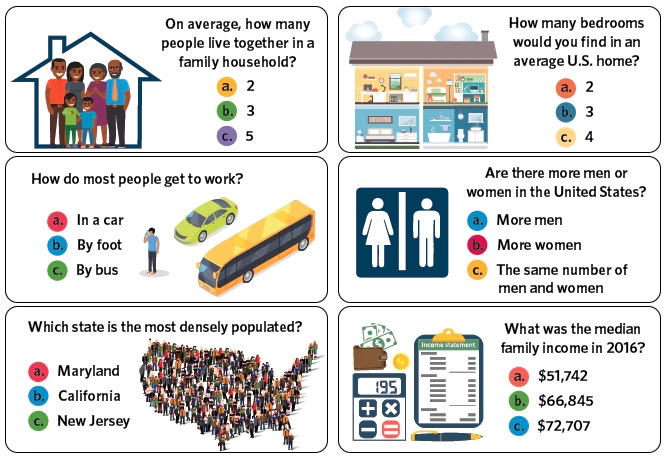
Step 5. Short Statistics Quiz
Play the Statistics in Schools Quiz to see if you can answer questions from the Census. The Quiz has questions such as: how many bedrooms are in an average U.S. house, how much candy an average American eats in one year, how do most people get to work, and more.
Optional: Play the Bracketology Game (15 min)
Population Bracketology Game (takes about 15 min): Go to the following web site.
https://www.census.gov/dataviz/visualizations/057/
Compare the State Populations and see how well you do!
- At the bottom of the bracket click on State Population
- Click on New Game
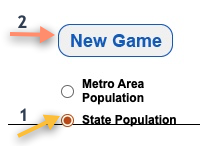
- Click on New Game
- Click on the State in each pairing that you think has the larger population
- If you are correct the one you selected will show up in Green and you will get some points!
- If you are incorrect it will show up in Red-orange like Oregon in the image below, but the correct state with a larger population, Colorado, will be shown on the bracket line. That way you can continue to gain points in the next round!
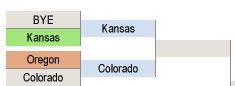
- Some states will already be there in round one for you because they aren't in a pair and you will see the label "BYE" where only one state is in the pairing.
- A perfect score is 63! See how close you can get.
- You can start a new game, or if you want a different challenge play the game with Metro Area Population instead of State population.
Good luck!
Optional: Money Smarts for Grades 3-6
Grades 3-6 OPTIONAL: Money Smart Kids videos from Discovery Education and the Jackson Charitable Foundation target grades 3-6 on Cha-chingusa.org/videos
- Check out Episode 3: Entrepreneur and Justin's Lemonade Stand
 Check off this Quest on the 21t4s roadmap

 I have completed the Quests as assigned by my teacher.
Go to the Quest 10 Sort It Out


Competencies & Standards
MITECS Michigan Integrated Technology Competencies for Students, and
1. Empowered Learner
d. Understand the fundamental concepts of technology operations, demonstrate the ability to choose, use and troubleshoot current technologies and are able to transfer their knowledge to explore emerging technologies
3. Knowledge Constructor
c. Curate information from digital resources using a variety of tools and methods to create collections of artifacts or solving authentic problems
d. Build knowledge by actively exploring real-world issues and problems, developing ideas and theories and pursuing answers and solutions
5. Computational Thinker
b. Collect data or identify relevant data sets, use digital tools to analyze them, and represent data in various ways to facilitate problem-solving and decision-making
c. Break problems into component parts, extract key information, and develop descriptive models to understand complex systems or facilitate problem-solving
6. Creative Communicator
a. Choose the appropriate platforms and tools for meeting the desired objectives of their creation or communication
b. Create original works or responsibly repurpose or remix digital resources into new creations
d. Publish or present content that customizes the message and medium for their intended audiences
Websites and Documents
Websites
- Canada Census Fact Sheets
- Census Bureau 101 for Students
- Michigan Facts
- Population Bracketology Game
- U.S. Census School Facts
- U.S. States Census Data
- World Factbook
Videos from Outside Sources
21t4s Videos
21t4s Documents & Quizzes